Posted: October 4, 2017

Photo: Riccardo Battisti
What role solar thermal will play in the energy sector in 2050 is one of the principal questions that the international Task 52 research project Solar Heat and Energy Economics in Urban Environments intends to answer. As part of this IEA Solar Heating & Cooling Programme task, Denmark’s Aalborg University chose four major solar thermal countries in Europe – Austria, Denmark, Germany and Italy – to model their 2050 solar share in national heat production. The university’s estimates range from 3 to 12 % based on country and scenario, which would require 4 to 175 million m2 of collector area in each of the four nations. The solar share of all four was rather similar in high penetration scenarios, although climate, energy demand and network design vary significantly. That’s why the researchers from Aalborg concluded that “the findings can be applied to a variety of energy systems, including in countries that are not directly part of this study.” They also underlined the importance solar thermal could have in reducing pressure on scarce resources such as biomass.
After consulting with industry stakeholders about what is realistically possible and economically viable, the task members set boundary conditions for all simulations, namely a 20 to 50 % share of users who are connected to a district heating network or have their own solar thermal system installed at home and as little as 5 % waste of solar heat resources because of overheating in summer. The designs for assessing solar thermal potential consisted of single-family homes with stand-alone heating solutions and solar district heating with short-term storage.
The simulations were based on the techno-economic EnergyPLAN model developed and maintained by the Sustainable Energy Planning Research Group at Aalborg University. This model simulates national energy networks – such as in the power, transport, and heating and cooling sector and in industry – by the hour. According to www.EnergyPlan.eu, the freeware “has been used in hundreds of scientific publications and reports” all over the globe.
The baseline year was 2010; the reference case was a business-as-usual (BAU) forecast, which expects that between 2010 and 2050, solar thermal will not make a larger contribution than it already has (see the chart below).
Next up were scenarios including more favourable developments, from reduced heat demand because of retrofits (Heat savings) and the expansion of the grid (District heating) to a high renewable share in heating and electricity (High RES).
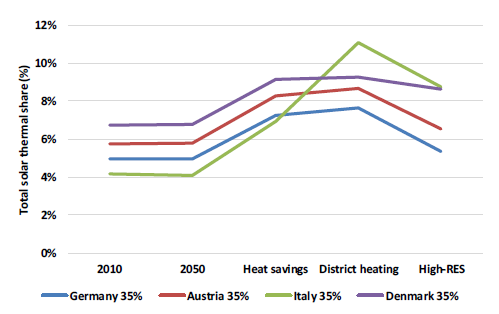
Technical solar thermal potential at 35 % average solar thermal penetration in 2050. The Total Share on the left refers to overall heat production. Solar cooling was not part of the simulations.
Source: Aalborg University
The graph above shows the solar thermal potential of the four countries, assuming an average penetration rate of 35 %, meaning 35 % of all buildings are connected to a solar thermal plant either located directly inside the building or available through a solar district heating network. The two scenarios favourable to solar thermal are Heat savings and District heating. Italy shows a significantly higher solar share in the latter, because of many existing district heating networks (which supply 70 % of all heat) and only very few baseload heat plants in operation, for example, to process waste energy. Denmark’s district heating share is high too (60 %), but the country has already seen the installation of many baseload waste-to-energy systems, which decreases flexibility and leaves little room for new solar thermal units.
In the Heat savings scenario, reduced heat demand in buildings will lead to a potentially greater contribution of solar thermal to both domestic hot water production and space heating. A broader deployment of networks in the District heating scenario will increase solar thermal use because of added options to store and distribute heat among consumers and more flexibility due to hybrid systems, for example, heat and power and heat pump combinations. In the High RES scenario, solar potential decreases because of a wider use of other heat sources such as geothermal, industrial waste heat and waste-to-energy.
Between 4 and 175 million m2 of collector area by 2050
The researchers underlined the importance of analysing the entire network system at once to capture developments across energy sectors. A scarce resource such as biomass will be in high demand in all energy markets in the future, increasing the relevance of solar thermal supply. The simulations have shown that installing the maximum available solar thermal potential could reduce biomass demand by up to 2 % overall – or by more if the focus is only on the heat and power industry.
Obviously, the solar penetration rate is inextricably linked with the total solar thermal potential of both individual and district heating. The possible solar thermal share ranges from 5 to 8 % in overall heat production, assuming the above-mentioned rate of 35 %. This share will increase to between 6 and 12 % at 50 % penetration and decrease to between 3 and 6 % at 20 %. Table 1 below indicates that the solar thermal share rises significantly in the Heat savings and District heating scenario, as does the installed collector area, but the total solar yield decreases because of lower demand in general, which requires less capacity to be installed.
|
|
Germany
|
Austria
|
Italy
|
Denmark
|
|
Penetration*
|
20 %
|
50 %
|
20 %
|
50 %
|
20 %
|
50 %
|
20 %
|
50 %
|
|
2010 baseline
|
25 TWh
3 %
72 Mm22
|
60 TWh
7 %
175 Mm2
|
3 TWh
3 %
6 Mm2
|
7 TWh
8 %
16 Mm2
|
9 TWh
2 %
28 Mm2
|
24 TWh
6 %
69 Mm2
|
2 TWh
4 %
6 Mm2
|
5 TWh
10 %
14 Mm2
|
|
Heat savings 2050
|
15 TWh
4 %
44 Mm2
|
38 TWh
11 %
111 Mm2
|
2.5 TWh
6 %
6 Mm2
|
5.5 TWh
12 %
16 Mm2
|
8 TWh
4 %
23 Mm2
|
19 TWh
10 %
57 Mm2
|
1.5 TWh
3 %
4 Mm2
|
3 TWh
10 %
10 Mm2
|
|
District heating 2050
|
16 TWh
4 %
45 Mm2
|
40 TWh
11 %
111 Mm2
|
2.5 TWh
6 %
6 Mm2
|
6 TWh
12 %
16 Mm2
|
12 TWh
6 %
32 Mm2
|
25 TWh
12 %
78 Mm2
|
1.5 TWh
4 %
4 Mm2
|
3 TWh
12 %
10 Mm2
|
|
High RES 2050
|
13 TWh
4 %
37 Mm2
|
26 TWh
7 %
77 Mm2
|
2 TWh
5 %
6 Mm2
|
4 TWh
8 %
11 Mm2
|
11 TWh
6 %
28 Mm2
|
20 TWh
11 %
59 Mm2
|
1.5 TWh
4 %
4 Mm2
|
3 TWh
11 %
9 Mm2
|
Table 1: Technical solar thermal potential by energy output, share and installed collector area at two rates of penetration (20 and 50 %). The percentage describes the solar share in total national heat production and includes such losses as the ones in district heating networks. In this table, Mm2 is short for millions of square metres and indicates the collector area required.
Source: Aalborg University
|
Annual solar yield [kWh/m2]
|
Germany
|
Austria
|
Italy
|
Denmark
|
|
Individual heating
|
330
|
402
|
451
|
314
|
|
District heating
|
410
|
500
|
560
|
390
|
Table 2: Solar yield assumptions (in kWh/m2) for the four countries and both applications
Source: Aalborg University
The article was written by Riccardo Battisti, a solar thermal consultant and market researcher working at Ambiente Italia (Rome, Italy).
Websites of organisations mentioned in this article: